Creating a Music Matrix with the Web Audio API

Last week I stumbled on this Tone Matrix, which uses the Web Audio API to generate and play sounds. I got really interested in the mechanics of sound generation and wondered how they did it, but unfortunately, there’s no source… so I decided to learn more about the Web Audio API, and recreate the matrix as an exercise. The source is available on github.

I’ll be running a tutorial for Women Who Code Sydney in July on how this works, and plan to cover some different filters and effects you can run sound through to get more interesting results (the matrix in its current state is pretty basic). There is more mathematics than I had bargained for, but producing a basic sound doesn’t really require a lot of code.

You’ll need to have a fairly recent version of your browser to play with the demo.

Screen Shot 2014-06-18 at 8.14.51 pm

Things I learned:

  • You can use existing sound sources (existing files, microphone) but also generate a sound wave with an Oscillator.
  • It’s a pipeline. Only one thing should output to your speakers.
  • Each audio buffer note can only be played once. You need to recreate each new note to play.
  • Sometimes there are loud ‘click’ noises as you abruptly change the notes through the speakers. You need to cater for this with some filters, or gain (aka volume control).
  • The API has been in development/experimental phase for quite a while and there’s not a lot of comprehensive documentation available. Most of the learning came from code samples.

Some interesting reading:

Heroku vs Amazon from Australia

I thought this was interesting to share.  I live in Sydney, Australia, and I was looking for relatively easy hosting setup for an Australian audience. I had two options: go with a platform-as-a-service provider like Heroku, or spend more time setting up my own infrastructure with AWS which has a datacentre in Sydney. Azure isn’t available here yet, but it’s coming real soon now(tm).

Both Heroku and AWS offer free tiers, so I didn’t need to shell out any money. I’ve used AWS before, so I figured I’d give Heroku a try.

Heroku

I won’t cover the pros/cons of Heroku as lots of people have already done it, but deploying my first app was really smooth and easy. At the time of writing you can only host in the US (EU is in beta), so I went with the default US option.

When you deploy, your app runs on a unit called a dyno, which is heroku’s equivalent of a server, and your hosting dyno will sleep after an hour of inactivity if you’re on a free tier.   I noticed a lag on page load occasionally when the dyno was waking up, so I threw it in web page test to measure*.

It takes 9 seconds for the user to see anything meaningful on the screen. Ouch.

heroku-summary

heroku-graph

 Amazon Web Services

I decided to try Amazon using their platform-as-a-service, Elastic Beanstalk. You do share underlying architecture when you’re on the free tier, but there’s no concept of your machine ‘sleeping’ like the dyno does.

Once I got the deployment working, it was noticeably faster than Heroku for a cold start.  Time to start rendering is much faster at just under 2 seconds (and reducing that time is my problem now, not the hosting). Here are the comparison graphs.
amazon-summary

amazon-graph

There is a downside, though – hosting with Amazon takes a lot more persistence because their documentation kinda sucks. It’s huge and contradicts itself in different articles, so you aren’t quite of the right thing to do. I followed these instructions to deploy a node.js app and ran into three different issues, one of which was because I’m trying to deploy region which isn’t the default US-East. If I wasn’t already familiar with AWS, I might have given up.

* Technically, I didn’t test from Australia – I used the Wellington, NZ agent in case the Sydney agents were hosted in an Amazon data centre.

Winners of She Hacks 2014!

I was really excited to attend the inaugral SheHacks 2014 hackathon in Sydney, organised by the lovely women from Girl Geeks Sydney – Georgi Knox, Denise Fernandez, Kris Howard, Sera Prince McGill and Peggy Kuo. It was held at Google’s offices in Pyrmont and was a fantastic event! (SheHacks was running in parallel in Melbourne too, so you can check out a rundown of the Melbourne event by Tammy Butow.)

Everyone hard at work

It was the first hackathon for quite a lot of people, and it was great to see people getting involved in an event they might not otherwise attend.  Tickets for the event were sorted into several types:

  • Developers (the majority of the tickets)
  • UX/Designer
  • Non-technical

People were encouraged to form teams of about 5 people – 3 developers, 1 ux person, and one non technical – with the goal that your devs can build, the UX person makes it look amazing, and your non-technical person can coordinate and concentrate on your presentation (following excellent advice laid out by Kris just a month ago on presenting your hackathon project.)

Team Disasterama (minus me)

I was also amazed at the generous catering – pizza, caffeine, snacks, lots of cookies made by team mate Denise, and a decidedly un-male breakfast spread of yoghurt, muesli and fresh-cut fruit!

snacks aplenty

The result? 50 women in 11 teams competed for some great prizes donated by Google, Atlassian, Microsoft and Razorfish. There were some fantastic team hacks presented, and I personally enjoyed:

  • Mini Jobs – finding odd jobs for younger people to do to boost their confidence/skills and earn some pocket money
  • Share the Paw Paw – crowdsourcing locations around your neighbourhood where fruit and vegetables are freely available, or if you have a surplus to give away
  • Coffee Run – formalising coffee rounds in the office, including keeping tabs of who owes who

HOWEVER… our team of Denise Fernandez, Luciana Carrolo, Kim Chatterjee, Anna Zaitsev and myself won first prize with our “Mission Possible” app!! The site is designed to connect volunteers with coordinators to assist with disaster relief. The amazing prezi designed by Anna and Kim describes the idea in detail.

The source code is available on GitHub. The app was designed to be realtime so that volunteers can see up-to-the-minute information about where their help is needed, and in our demo we used two screens to great effect (realtime updates are always a crowd pleaser!). It was written using node, socket.io, handlebars, google maps, twitter bootstrap and a lovely set of custom icons designed by Kim.

A screenshot from our app shows a shaded area where the “disaster” has occurred (an oil spill), and a point which is the muster point for volunteers to go to to help (save the penguins!). Everything updated in real time from a master coordinator, who would add extra muster points and specify numbers of volunteers that should be at each point.

Mission Possible

Our prize was a Nexus 7 tablet and a 3D printed trophy, which was a pink computer.

Hello, computer!

I was pretty happy with the outcome of that! It’s the third hackathon in a year that I’ve participated in and won prizes for.  I really love the energy and creativity that comes out of such an intense situation, and it’s a lot of fun to see what everyone else does in such a short time as well.

Thanks very much to Girl Geek Sydney for a great event!

Save the penguins!

Three days of Haskell

I spent three days up in Brisbane between March 17-19 on a course called “Introduction to Functional Programming using Haskell“.  It was intense!

The course was run by Tony Morris & Mark Hibberd from NICTA, and Katie Miller from Red Hat. It was originally billed as Lambda Ladies, but it turns out there weren’t quite enough ladies to fill the course, so anyone else interested was invited along too.

The course is a bunch of practical exercises. They excluded the standard Haskell library from the project, and we spent time reimplementing first principles, starting with functions involving Lists.  It’s a very hands-on way of learning how Haskell works. The first day covers pattern matching, folding and functional composition, the next couple deals with abstracts on binding & functors, getting towards monads. You spend some time implementing a couple of concrete problems – a string parser, and a problem involving file IO – to see Haskell in practice.

If you’re familiar with functional programming, you’d understand that’s a LOT of material to cover in three days. I would say that the average learning curve went a bit like this:

Screen Shot 2014-03-20 at 4.39.53 PM

However, having a solid understanding of programming concepts (e.g. lambdas) meant that the more complex concepts were a lot easier to pick up (to a degree).  When I was learning functional programming at university, it took me days to reimplement map properly in Haskell!  Earlier this week, it took five minutes.

Getting to your solution for each problem felt a lot like algebraic substitution and refactoring. First, you make it work, and then you refactor constantly to get the most elegant (read: shortest) solution by taking advantage of functional composition.

I was surprised at how much it ended up looking like a normal chained method once you introduce the point notation, aka functional composition, which is something C# looks to have borrowed heavily from when introducing LINQ.

To take the example from the link above,

ghci> map (\xs -> negate (sum (tail xs))) [[1..5],[3..6],[1..7]]  
[-14,-15,-27]

turns into…

ghci> map (negate . sum . tail) [[1..5],[3..6],[1..7]]  
[-14,-15,-27]

I was also surprised just how much of a rush it was to a) have a solution that type checked properly, and b) actually worked.  Haskell felt like an all-or-nothing proposition, where it either compiled and worked, or was otherwise hopelessly broken and gave you a type checked error that was difficult to decipher.  Otherwise, most other programming languages have a more granular feedback loop and are much easier to debug – you can put logging statements in, for example.

The best takeaway of all were these amazing lambda earrings!

Lambda Earrings

Learn You a Haskell is an excellent (and cute, and free) resource for learning Haskell.

Angry Birds in CSS

I recreated an Angry Bird in CSS as an experiment to learn more front end styling.  It has been tested on recent versions of Chrome and Firefox, but cross-browser compatibility wasn’t really the goal – I wanted to try drawing shapes and learn more about CSS transformations.

The code is on github, and you can preview the output here.

Learnings:

  • Any kind of non-standard shapes are difficult! Particularly curves and the border-radius property, which has a slightly confusing syntax.
  • Triangles can’t have borders easily 😦
  • This.

angry-bird-css

Finding a Memory Leak

This post originally appeared on the 7digital developer blog on 15th February 2011. It has been moved here for preservation. 

A few weeks ago, we launched the shiny, redesigned new 7digital.com to a beta audience. Unfortunately, we had a memory leak.

The new site was hosted on the same set of hardware as a few other applications, and it was gradually bringing the other sites down. We put a limit on the amount of virtual memory to shield the other sites from the memory leak,  but performance kept deteriorating. Thankfully, the memory leak was eventually found – here’s a set of steps I followed to find it.

Step 1: Take a memory dump from the live site

Graham, a fellow dev, helpfully pointed out userdump and also gave me a crash course in windbg. Userdump is a command line tool which will take a snapshot of the memory space used by a process. It’s important to note that it freezes your process while it takes the dump, so if you’re doing this in live, your site might stop for a minute or more. You can use the inbuilt iisapp.vbs script on the command line to find out exactly which w3wp process belongs to which Application Pool, and therefore which process to dump. Once you have the process id, take the memory dump and examine it with windbg.  Two useful articles were Getting Started with windbg by JohanS, and Tess Ferrandez’s excellent lab/tutorial on how to navigate through a memory dump.

Step 2: Add some performance counters

Since the live dump didn’t highlight any obvious problems (it only had information for a minute or less of runtime before the app pool recycled), we added some performance counters to see if we could find any trends. You can access perfmon under Start > Administrative Tools > Performance.  MSDN has a good explanation of the different counters and what they mean. Since we were concentrating on memory, I added the following counters and waited for any trends to appear.

.NET CLR Exceptions\#Exceps thrown
.NET CLR Memory\#Bytes in all Heaps
.NET CLR Memory\Gen 2 Heap Size
.NET CLR Memory\Large Object Heap Size

Edit: It’s possible to show counters for a single process, but if you have multiple w3wp processes running on the same box (as we do), it’s difficult to get the counters for the right one.  I was looking at counters for the whole box, which didn’t give me a lot of detail.

Step 3: Do some local profiling 

A live memory dump is all well and good, but it just looks like a screen full of hex 🙂 Local profiling gives you some lovely graphs, stack traces, statistics on running time, etc which you can use to drill down into specific methods or lines of code. If you know what user action is causing the leak (e.g. clicking the “Purchase” button), you can profile that on your local machine and easily identify which method or line of code is causing the problem.

I downloaded ANTS Memory ProfilerDotTrace, and AQTime to try some local profiling. The learning curve on ANTS seemed to be the gentlest, although if you are familiar with any of the tools, it would help greatly. The ANTS inline help files were an excellent refresher course on how .NET garbage collection works.

Step 4: Local profiling with load testing

I spent about a day learning how ANTS works, and doing some common page loads on my local machine. I didn’t see anything unusual. But…. my mistake was to profile without load. It’s very difficult to spot trends unless the changes being made by an action are exaggerated.

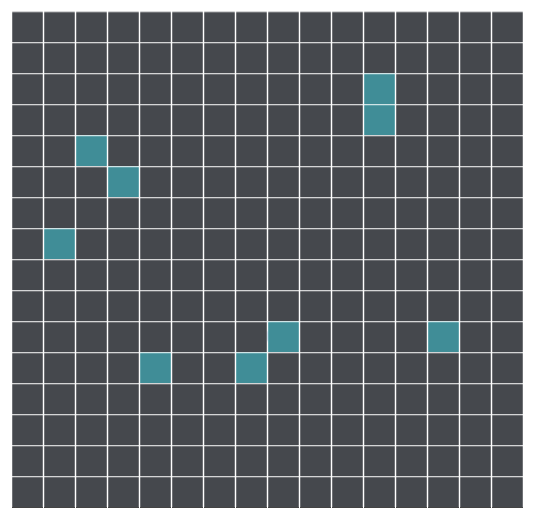
ApacheBench was recommended, which is a command line tool for benchmarking performance, but also handy for making lots of concurrent requests. So I lined up multiple requests (and executed them multiple times, all while running ANTS) for common pages in our site, like the search page, artist page and album page. Nothing really turned up until I tried to add products to a basket – and got my breakthrough. Here are the two graphs of memory usage from ANTS. The first shows code behaving itself and being cleaned up by the garbage collector when some normal actions were load tested. The second illustrates our memory leak – the line in green highlights the total memory (managed + unmanaged) being used by our process, the line in red is the amount of managed memory allocated by .NET. Unforunately, this meant that our leak was in unmanaged memory, which ANTS couldn’t help me track down.

Good memory profile:

trace-good

Bad memory profile:

trace-bad

Step 5: Finding unmanaged memory leaks

So, back to the dump taken from the live site with userdump.  James Kovacs has written a helpful article which, among other things, lists reasons why you might be leaking unmanaged memory.  I took another memory dump with more user activity to examine, and had a look at the assemblies in the app domain. Along with the usual suspects:

Assembly: 034a3fd8 [C:\WINDOWS\Microsoft.NET\Framework\v2.0.50727\Temporary ASP.NET Files\b\970be4ca\1a5ec57f\assembly\dl3\139d25740cf5f9d_99b8cb01\Lucene.Net.dll]
ClassLoader: 034a4048
SecurityDescriptor: 034a3d18
Module Name
04ac1d74 C:\WINDOWS\Microsoft.NET\Framework\v2.0.50727\Temporary ASP.NET Files\b\970be4ca\1a5ec57f\assembly\dl3\139d25740cf5f9d_99b8cb01\Lucene.Net.dll

....

There were an enormous number of dynamic assemblies being loaded into our app domain:

Assembly: 286ff688 (Dynamic) []
ClassLoader: 286ff6f8
SecurityDescriptor: 286ff600
Module Name
0062429c Dynamic Module
0062461c Dynamic Module

This was the reason that the memory kept increasing. Some piece of code was dynamically loading assemblies, and once there, they never get unloaded. However, it’s very difficult to get any more information about them in windbg for framework version 2.0.  Windbg for v2.0 has less commands than windbg for v1.1 (strange!), and the internet seems to be full of demos using windbg 1.1 showing more information than you get now.   They are a good starting point, but be aware you won’t be able to follow them 100%. Tess Ferrandez again has a great tutorial on chasing down unmanaged memory leaks if dynamic assemblies aren’t your problem.

Step 6: Local debugging

The Modules window in Visual Studio shows you which assemblies have been loaded, and it gives you more information than windbg (the name of the assembly, at least) so it was just a matter of repeating the step that caused the error with the debugger attached, and watching when the number of assemblies changed. The culprit was finally found – it was the Application_Error event handler.  We were mis-using a piece of 3rd party code which was creating dynamic assemblies every time an error occurred. And unfortunately for us, it was a catch-22 because our beta users were finding errors we’d missed in testing, making the leak worse.

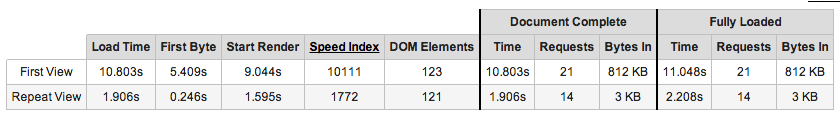
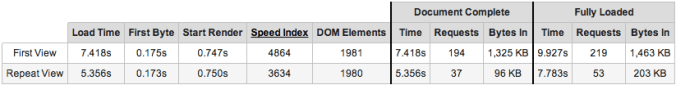
Step 7: Verification Profiling

We fixed the offending code, and then re-profiled with ApacheBench to verify that the memory was no longer leaking. The whole process took almost three days to track down and fix, mostly because I hadn’t managed to isolate what action was causing the leak. Once I started load testing, the leak was much easier to identify. I was amazed at the number of tools and apps used when trying to find the leak, mostly to rule things out in a process of elimination. Quite satisfying once found, though 🙂

Managing Dependencies With TeamCity

This post originally appeared on the 7digital developer blog on 8th June 2011. It has been moved here for preservation. You can also use a newer TeamCity feature called Snapshot Dependencies for a cleaner way of managing dependent builds. 

We have recently switched to using TeamCity to manage the building and updating of our shared code at 7digital, which is great.  The process is fast, completely automated and configurable, which is a vast improvement over our old build process – very manual, error prone and could take up to 3 hours of a developer’s time.

Background

We have a large set of “domain” dlls which contain a lot of legacy code shared between several applications. When someone updates this code, we need to ensure that:

  • All domain dlls are compiled against each other for build integrity
  • The newest version of the domain set is available to all projects
  • All consumers should update their references as soon as possible to catch any bugs.

Here is how we do it using TeamCity and a set of project conventions.

Solution & Folder Structure

Each solution has multiple projects, and a lib folder which contains third party and in-house domain dlls used by the projects in that solution. By convention, the lib folder sits in the top level folder.  Projects create references to the dlls straight from this location.

lib-folder-explorer_0

Updating a dll in the lib means that all projects will use the new version immediately. This is really handy for upgrading all projects to a new version of a third party tool like NUnit, RhinoMocks or StructureMap, but it also works for our own in-house dlls. All we need is an automated way of updating the dll in the lib folders to the latest version whenever someone commits a change. Enter TeamCity!

Using Teamcity

We’ve placed the set of in-house domain projects in a linear build order.  Each project in the list is configured to trigger the next in line when it successfully builds, using the TeamCity “Dependencies” tab. If somone makes a change to a domain project, TeamCity will pick up the commit, build the project and run its tests, and this will kick off the rest of the chain underneath. In the screenshot examples below, I’ve used a portion of our domain chain where SevenDigital.Domain.Catalogue is dependent on SevenDigital.Domain.Catalogue.MetaData.

domain-triggering1_0

We split each project into two (or more) builds in TeamCity, which are run in order if the previous build succeeds. 0) Dependency 1) Build and Unit Test 2+) Integration Tests (if they exist), code metrics, etc.

domain-front-page_0

Build and Unit Test

The (1) Build and Unit Test is a normal build triggered by developer check in, which builds the solution and runs unit tests.  On each successful run, it will export the assemblies from its lib folder and \bin\debug folder to artifacts, using TeamCity artifact paths.   The assemblies are then accessible by other TeamCity builds, and used by the (0) Dependency Build.

domain-general-settings_0

domain-artifacts_0

Dependency Build

The (0) Dependency Build is always triggered by a previous build in the chain.  It is responsible for updating the project lib folder with the latest versions of the previous build’s dlls, which sounds a bit complicated, but is easily broken into steps. We use the build agent like an automated developer – it checks out the project source code to a local folder, pulls down the artifact dlls from the previous build to the local lib folder, and then does a command line commit to either git or svn depending on where that project is hosted.

    1. On the “Version Control Settings”, we always set the VCS checkout mode to “Automatically on agent”.  This means the source code goes to the build agent machine rather than on the central server.domain-vcs_0
    2. On the “Dependencies” tab, we add an Artifact Dependency to the previous Build & Unit Test in the chain, taking all of the published dlls.  The destination path is set to “lib”, meaning the agent takes care of downloading the dlls into the local lib folder, effectively overwriting them (or adding new ones in to the folder if they don’t already exist).  From a version control point of view, the lib folder now looks like it has updated files that are ready for checkin. domain-dependencies_0
    3. We use an msbuild or rake task that executes a command line commit from the root folder.  The agent already has a link back to the main repository, because we checked the code out directly to the agent.
(svn|git) add .
(svn|git) commit -m "Auto Commit from $(agent_name) for build no $(build_number)"
  1. The commit from the agent is just like a regular checkin.  It triggers (1) Build & Unit Test, and the cycle continues down the chain.

Setting up the entire chain took a large amount of configuration, but it’s been worth it. The biggest gain has been removing the manual component of the build, which means we get faster feedback if something is broken, and people are able to make changes more confidently.

preparing for a technical interview at amazon or google

In October last year, I was offered a job to move to Seattle and work at Amazon!

(woohoo!)

It was an incredible opportunity. Amazon are giants, have interesting problems of scale to solve, and the chance to work in the US would be fantastic. Unfortunately, personal circumstances weren’t quite suitable for a move to the states at that time, and I had to decline. However, I really valued the experience and the chance to learn more about Amazon.

The offer meant that I felt brave enough to try for a job at Google in Sydney later that year. I didn’t do as well in that process, but the study techniques for both were the same.

There was a lot of work and preparation that went into the interviews – easily 60 to 80 hours. Here is a list of resources I found useful.

Cracking the Coding Interview by Gayle Laackman
This is an excellent book, and I would highly recommend this as the first port of call if you are short on time. For each category of problem (e.g. binary trees, bit arithmetic, logic, graphs, etc) there is a summary, hints and tips to look out for when answering the questions, sample questions and sample answers. I didn’t find anywhere else that collated this in one place.

This book will save you a lot of time and effort on research, and the sample questions are great to try as a warm up.   Most of my study time was spent attempting the questions in this book and trying to work out better/more efficient solutions. I would answer the first few questions without a time limit, and then try the next few with a 15 minute time limit – which is a realistic interview scenario.

Studying the performance/memory/space restrictions when answering the questions will probably make you stand out from the crowd.

Interactive Python course
Problem solving with data structures and algorithms does an excellent job of distilling complex topics into something really clear that you can follow.  It’s the right level of density and simplicity, with clear examples and descriptions of each data structure and algorithm, much better than the wikipedia versions.  I often came back to this site for reference. The sample code is in Python, but still very easily digested as someone who doesn’t know the syntax.

YouTube Videos
I had varying success looking at YouTube for some technical interviews (some were incredibly s-l-o-w, some were hard to understand) but I found a great series by Dickson Tsai, a tutor at UC Berkeley, called Data Structures in 5 minutes. The videos were good at concisely explaining a topic, although I often had to pause them to catch up. They alerted me to the existence of some concept that I might not have known before, e.g. the concept of a strongly connected graph. The main drawback is that the videos aren’t shot very professionally, but they do convey a lot of information in a short amount of time. Like speed studying. He also has a series of photos that go with the videos, because the board can be difficult to read at times.

There are also an amazing series of videos by AlgoRhythmics, which uses Hungarian folk dancing to show the efficiency of various search algorithms. I highly recommend them: as well as clearly highlighting the differences between algorithms, they are seriously awesome. I would like to buy a beer for the person who a) thought up the idea, and b) convinced an entire dance troupe to perform them.

Tips and tricks from current Googlers
Steve Yegge’s  Get That Job at Google and Cate Huston’s interviewing @ Google cover A LOT of different topics that you might encounter in a technical interview. It’s pretty much the same list that I was given by my Amazon and Google recruiters for study topics. It’s huge, and overwhelming. You won’t be able to cover it all in-depth, but nobody else will either.

Big-O Cheat Sheet
A list of all of the algorithm and data structure Big-O complexities in a single page.  It includes best, average and worst case time and space complexity and links to the relevant wikipedia articles.  Good to have handy if you’re having a phone interview!

Glassdoor
Glassdoor is a good source of information about your potential employer, and the kinds of questions that might get asked in the interviews – just take the reviews with a grain of salt. If you trawl through the reviews and interview question examples, you will get a good idea about the kind of topics they cover, and possibly how difficult the questions might be.

Other things I found useful

  • Whiteboard & Whiteboard markers – I bought a cheap whiteboard and some thin whiteboard markers to practice solving problems, as you’ll have to do whiteboard coding in your interview.
  • Take photos of your solutions as you solve them, so you can review what you’ve done
  • Have a topic checklist. It helps you clarify what you need to study (you will be adding new topics to that list daily), AND you’ll feel great every time you tick something off that list.
  • Start a language topic translator if applicable – in my case, C# to Java. As you try to solve each problem, if you need to look up any language syntax just jot it down in a centralised place you can reference later.

Both Amazon and Google also provided an extensive list of material to review prior to interview. It included videos of what to expect on the day, hints and tips for what your interviewers will be looking for, and expected topics. Some of this material was private/password protected, so I don’t feel like I can share it here, but your recruiter will definitely provide a lot of information for you to review.

Good luck! 🙂 Feel free to ping me personally if you would like any more detail about my experiences with either Amazon or Google.

YOW Sydney

I won a ticket to this year’s YOW conference in Sydney – thanks to Girl Geek Dinners!

I really enjoyed the talks by places doing Big Scale things, especially talks by Adrian Cockcroft (Cloud Native Architecture at Netflix), Ben Christensen (Creating Observable APIs with Rx) and Joel Pobar’s insight into Facebook’s culture (“Move Fast and Ship Things”). Both of these companies have hit limits in hardware, architecture, processing power, and general demand which have forced them to engineer new and creative solutions to meet those limits. In Netflix’s case, they have ported Microsoft’s Rx library into Java, and have some brilliant automation around deployment. Facebook has written their own PHP virtual machine to improve performance, up to nine times faster than traditionally interpreted PHP. They have also been introducing types into PHP, so that in future they can optimise their runtime engine even further.

The level of autonomy given to developers, and the sophistication of the toolsets in use daily sounds phenomenal in both companies. I am a huge admirer of engineering teams which have internal teams & tools focusing on making other developers more productive; it’s a sign of team focus, maturity, and investment in quality.

Jim Webber’s A Little Graph Theory for the Busy Developer was a great talk, particularly as someone who has recently re-learned graph theory since I wasn’t as lost as I normally might be. His slides are definitely up there as some of the most entertaining, with the inclusion of a Dr Who graph and slides illustrating via graphs why World War II was predictable. Jim has also authored REST in Practice, a good read for anyone interested in API design.

Live Coding for Creative Performances, aka “algo-rave” by Andrew Sorensen is actually more appreciated when you watch the video. I thoroughly enjoyed this session! Andrew demonstrated how he could use language features in Lisp to generate a music track. Starting with a blank slate, he gradually added beats, track sampling and evolved it into an increasingly complex algorithm/track, programming it in real time.

Jared Wyles Tuning for Web Performance had some interesting suggestions on using Chrome’s memory and performance benchmarking and putting that in a build pipeline, so that you can measure historical which I will definitely be investigating for our future projects at work.

I also very much enjoyed Stewart Gleadow’s No App is an Island, a discussion on the benefits of REST/hypermedia backed up by a case study of the realestate.com.au iOS app. Great takeaways included using links as remote feature toggles (i.e. if the link is in the response, the feature is live, otherwise hide it!); minimising network calls by sending larger gzipped payloads of potential next requests; and letting your application’s API do some of the heavy lifting in terms of formatting/sorting if your client language (e.g. iOS/Objective C) is not efficient at those tasks.

Scott Hanselman’s keynote was basically an excuse to show off Azure. It was very entertaining. He’s a pretty hilarious guy.

General observations

  • Some conference-provided wifi would be great. No self respecting tech conference goes without wifi these days 🙂
  • More than normal, I found there were often two or three talks I’d wanted to attend simultaneously (e.g. Trisha Gee’s Career Advice for Programmers), and sometimes zero talks that I was interested in across the tracks
  • I’ve attended a lot of conferences in the UK, and the community seems to be a lot less active on twitter
  • I liked that there was good accessibility to the speakers, especially on the first day they seemed to be floating around all the drinks and events throughout the day.

improving page performance with WebPageTest

We are in the process of rebuilding Ninemsn’s front page in coffeescript + node.js, and moving it to Amazon Web Services (AWS) for easier deployment.

As we’re rebuilding the site, we’re quite conscious of improving page performance (or at least maintaining the current standard). I’ve been really impressed with WebPageTest, a free tool for performance analysis. It has some very in-depth analytical tools, and ranks your site according to Google’s published PageSpeed standards. It also keeps a history of past tests you’ve run for up to 12 months. The results are public and searchable by default, but there is an option to keep them private. Some of the excellent features are as follows:

Film strip view
WebPageTest takes a screenshot every 0.1 second as your site renders. This will show you how long it takes for a user to actually see something “above the fold” they can engage with on the page.  It’s not an easily obtained measurement, which is why it’s so valuable – in our case, a user can see and engage with our top stories in news while some of the slower advertising and javascript loads. If we looked at purely when the javascript finished loading, we’d have a terrible measurement (close to 10 seconds).  But in reality, onLoad happens a whopping 8+ seconds after the first “above the fold” experience a user has.  You can click on the filmstrip below to see the screenshots in detail.

filmstrip

Detailed request/Connection breakdown
This is a very similar view to Chrome or Firebug’s network tab, but it also gives the proportion of each request that was spent in DNS lookup, transfer and rendering.  It’s also broken down by asset type (css, js, etc).

ConnectionViewRequestDetails

It’s hugely valuable for you to see why a particular asset is slow – for example, if you are referencing a third party asset that takes a long time for DNS lookup and transfer, you might investigate if you can host it on your own servers or through a CDN. It also goes without saying that the fewer requests you make, the better, so sprites and combining/minifying CSS and JS assets can help you avoid network overhead time. An interesting feature that Google News does is to base-64-encode “above the fold” images directly into the page, to reduce the number of requests. I presume they are also gzipped with the page when it is sent down the wire, saving both requests and page size.

Analysis of Bandwidth and CPU usage
WebPageTest offers a graph of CPU and bandwidth utilisation throughout the render of your page – useful to see if you can improve your time to rendering after the files have been delivered to the user e.g. high CPU because there is some intensive javascript. Improving this measure would make a great difference to older hardware/browsers.

CPU-Bandwidth

Self hosting & Running from different locations around the world
WebPageTest offers the ability to run from over 40 different locations in the world, at last count. So you can check how your site performs when accessed from different parts of the world. You can also download the source and set up your own hosting server and testing agents if you wish, which gives you more control over where and when you’d like to run it. It would be very useful as part of a build pipeline, to run each check-in/day/week, and highlight the effect that recent changes have made to the page speed.

If you are using the public agent, or decide to host your own, be aware of where the test agent is hosted vs where your site is hosted. For example, if you are both in the same AWS data centre, then time to first byte will probably not be an accurate measure for the majority of users.

Multiple requests
One feature I really like is the fact that it executes two requests to your page, which highlights how much of your page is cached from the first request, and what assets could benefit from cache headers. The in-depth analysis of all the above features (film strip view, connection breakdown, bandwidth & CPU analysis) is done on both versions.

RepeatViewRepeatViewWaterfall1RepeatViewWaterfall

Visual Comparison of two different tests
You can also compare two results – for example, two weeks apart – to see the differences if you have been trying to improve speed, or if you have recently introduced a new feature to see the impact that has had.

There are even more features available – for example, a trace route. We noticed when testing our Akamai fronted page that our packets were actually being routed via Singapore (why? I don’t know whether it was AWS or Akamai, but we noted it down for later follow up, especially before we go live.)

In summary – WebPageTest is an extremely useful diagnostic tool, and best of all it’s free!