We are in the process of rebuilding Ninemsn’s front page in coffeescript + node.js, and moving it to Amazon Web Services (AWS) for easier deployment.
As we’re rebuilding the site, we’re quite conscious of improving page performance (or at least maintaining the current standard). I’ve been really impressed with WebPageTest, a free tool for performance analysis. It has some very in-depth analytical tools, and ranks your site according to Google’s published PageSpeed standards. It also keeps a history of past tests you’ve run for up to 12 months. The results are public and searchable by default, but there is an option to keep them private. Some of the excellent features are as follows:
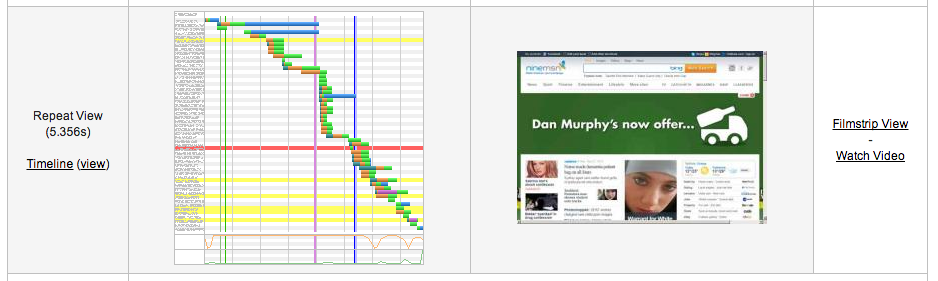
Film strip view
WebPageTest takes a screenshot every 0.1 second as your site renders. This will show you how long it takes for a user to actually see something “above the fold” they can engage with on the page. It’s not an easily obtained measurement, which is why it’s so valuable – in our case, a user can see and engage with our top stories in news while some of the slower advertising and javascript loads. If we looked at purely when the javascript finished loading, we’d have a terrible measurement (close to 10 seconds). But in reality, onLoad happens a whopping 8+ seconds after the first “above the fold” experience a user has. You can click on the filmstrip below to see the screenshots in detail.
![]()
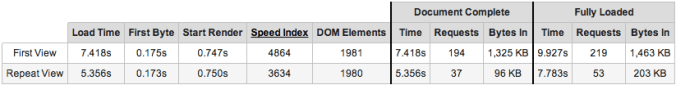
Detailed request/Connection breakdown
This is a very similar view to Chrome or Firebug’s network tab, but it also gives the proportion of each request that was spent in DNS lookup, transfer and rendering. It’s also broken down by asset type (css, js, etc).


It’s hugely valuable for you to see why a particular asset is slow – for example, if you are referencing a third party asset that takes a long time for DNS lookup and transfer, you might investigate if you can host it on your own servers or through a CDN. It also goes without saying that the fewer requests you make, the better, so sprites and combining/minifying CSS and JS assets can help you avoid network overhead time. An interesting feature that Google News does is to base-64-encode “above the fold” images directly into the page, to reduce the number of requests. I presume they are also gzipped with the page when it is sent down the wire, saving both requests and page size.
Analysis of Bandwidth and CPU usage
WebPageTest offers a graph of CPU and bandwidth utilisation throughout the render of your page – useful to see if you can improve your time to rendering after the files have been delivered to the user e.g. high CPU because there is some intensive javascript. Improving this measure would make a great difference to older hardware/browsers.

Self hosting & Running from different locations around the world
WebPageTest offers the ability to run from over 40 different locations in the world, at last count. So you can check how your site performs when accessed from different parts of the world. You can also download the source and set up your own hosting server and testing agents if you wish, which gives you more control over where and when you’d like to run it. It would be very useful as part of a build pipeline, to run each check-in/day/week, and highlight the effect that recent changes have made to the page speed.
If you are using the public agent, or decide to host your own, be aware of where the test agent is hosted vs where your site is hosted. For example, if you are both in the same AWS data centre, then time to first byte will probably not be an accurate measure for the majority of users.
Multiple requests
One feature I really like is the fact that it executes two requests to your page, which highlights how much of your page is cached from the first request, and what assets could benefit from cache headers. The in-depth analysis of all the above features (film strip view, connection breakdown, bandwidth & CPU analysis) is done on both versions.

Visual Comparison of two different tests
You can also compare two results – for example, two weeks apart – to see the differences if you have been trying to improve speed, or if you have recently introduced a new feature to see the impact that has had.
There are even more features available – for example, a trace route. We noticed when testing our Akamai fronted page that our packets were actually being routed via Singapore (why? I don’t know whether it was AWS or Akamai, but we noted it down for later follow up, especially before we go live.)
In summary – WebPageTest is an extremely useful diagnostic tool, and best of all it’s free!
